A large portion of the work associated with the Madison Tree Map was compiling the many tree inventories from various groups. The resulting dataset gives us a unique view into the regional urban forest composition. Much of this can be accessed by using the search functions built into the Madison Tree Map. For example, searching for “Ash” trees will pull up the number and location of ash trees.
The caveat with this dataset is that it is composed heavily of street trees, which are primarily trees that were planted within public right-of-ways. The difference between these areas and natural forest stands, or residential properties, is that nearly every tree was intentionally planted. Below is a summary of a few aspects of the Madison Tree Map dataset.
Species Composition
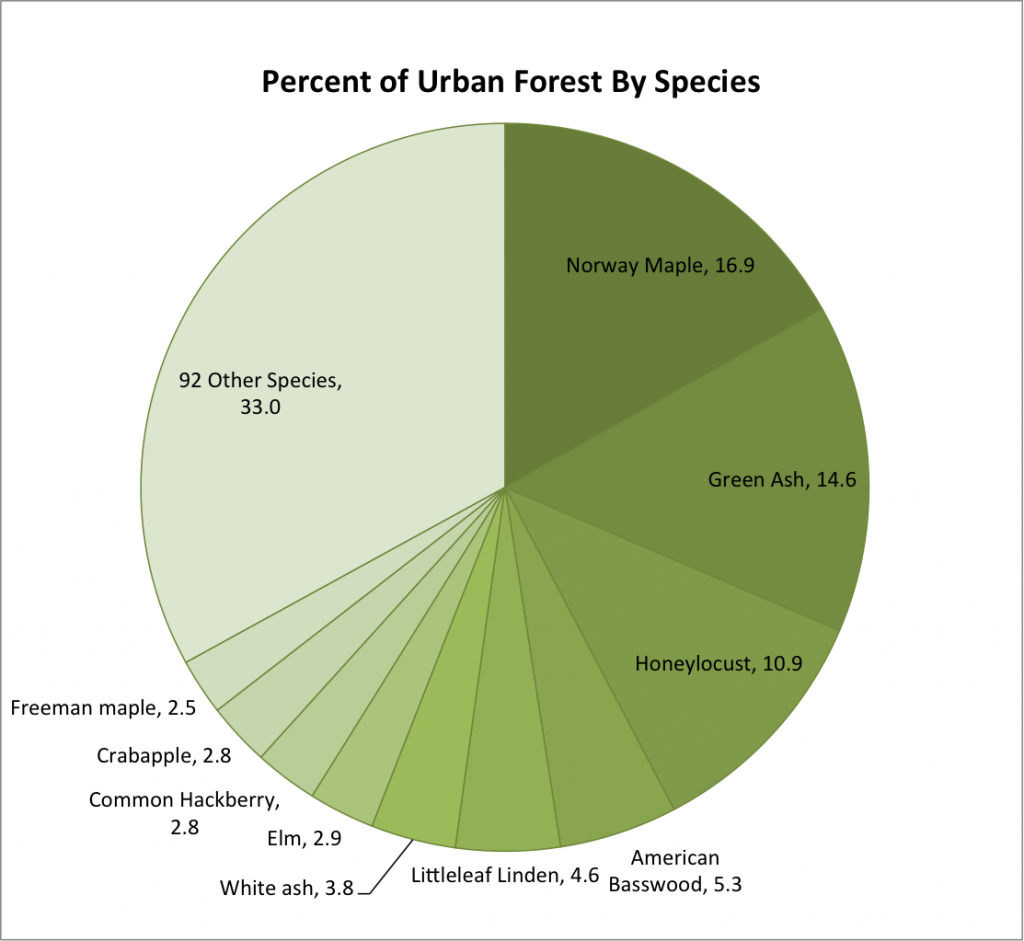
The Madison Tree Map contains 107 different species codes, but these species don’t occur in even numbers–not even close. Norway maple (Acer platanoides) is the most abundant tree species. There are over 26 thousand Norway maple trees in our inventory! The top ten most common species of trees account for 67% of all the trees; the remaining 92 species makeup only 33%. An urban forest composed of many species of trees, represented in similar abundance, is more resilient to pest and disease, which typically target a species or genus of tree.
Emerald Ash Borer
Why is the Emerald Ash Borer such a devastating pest? Partially because it is so good at killing trees–it has close to a 100% success rate–but also because there are so many Ash trees! Ash is a genus of tree (Fraxinus) and the Emerald Ash Borer can infest any tree belonging to that genus. In Southern Wisconsin these are primarily Green Ash and White Ash. There are 22,500 green ash and 5,821 white ash in the Madison Tree Map inventory, which account for 18.3% of all trees. If there were fewer ash trees, say 3 or 4 percent, the Emerald Ash Borer wouldn’t be as much of a problem.
Yearly Eco Impact
While navigating the Madison Tree Map website you’ll notice a column of numbers to the left of the map listing dollar values. These numbers correspond to ecosystem benefits (greenhouse gas, water, energy, and air quality) that the trees in our community supply. So, where do we come up with these numbers? The USDA Forest Service, with help from others, developed a computer modeling program called “i-Tree.” The numbers on the Madison Tree Map come from this program. The total value will just keep going up as we add more and more trees to the inventory!
Tree Genera
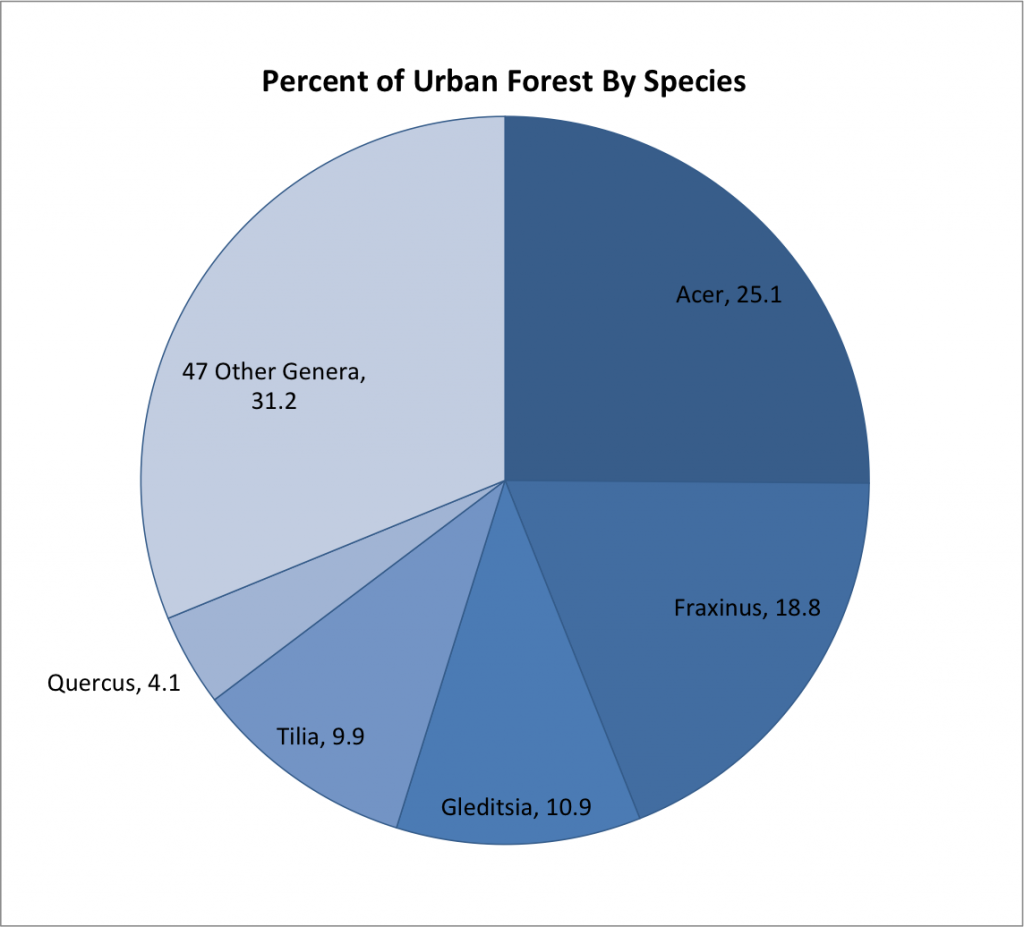
As mentioned above, the reason the Emerald Ash Borer is having such an impact on urban forests across the country is because of the high relative abundance of the Ash genus (Fraxinus). Catastrophic events like the Emerald Ash Borer or Dutch Elm Disease, which targeted North American members of the Elm genus (Ulmus), can be reduced by planting a more diverse mix of tree genera. Right now 25% of trees in the Madison Tree Map inventory are in the Maple genus (Acer). 69% of all trees belong to the 5 most abundant tree genera.


